SRE Foundations to Production: Alerting and EC2 Deployment (Part 3)
Enhance your Flask app with Prometheus alerting, Alertmanager notifications, and deploy it to AWS EC2 for a production-like setup.
In part 2, we added Grafana to visualize our Flask app’s metrics. Now, in part 3, we’re enhancing our setup with alerting and deploying it to the cloud. This moves us from passive observation to proactive monitoring and brings our app into an environment on AWS EC2 that mimics production. Here are the four steps I followed, using SRE principles.
Step 1: Track Errors for Full Observability
To catch issues, I added an error metric to the Flask app using Prometheus. This tracked failures such as missing tasks in POST requests, giving us the “Errors” piece of the RED method (Rate, Errors, Duration). It’s a small change, but it completes the picture we started with request rates and latency.
- Takeaway: Errors are a key signal and monitoring them closes the loop on service health.
- Action: Add an error counter to your app’s failure paths and expose it via metrics.
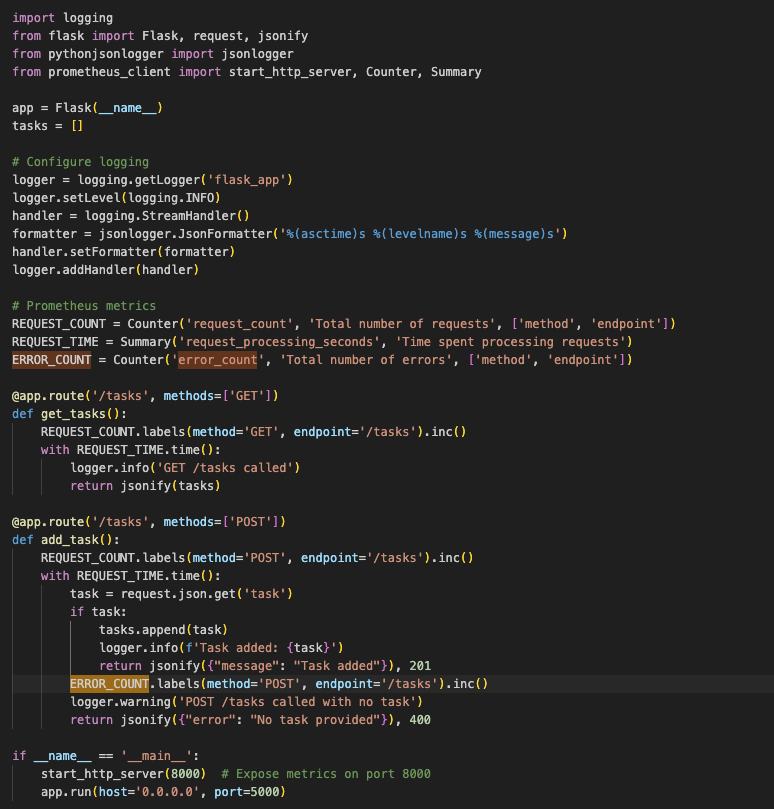 Error Count added to app.py
Step 2: Set Up Alerting with Prometheus and Alertmanager
Next, I configured Prometheus to detect high error rates and Alertmanager to handle notifications. A rule flags when errors exceed 0.01 per second for a minute, simple but effective for testing. Alertmanager logs these internally, setting the stage for emails or Slack later.
- Takeaway: Alerts turn metrics into action, essential for staying ahead of problems.
- Action: Define a threshold in Prometheus and link it to Alertmanager in your Docker setup.
Start with a simple threshold (e.g., 0.01 errors/sec) to avoid alert fatigue—tune it as you learn your system’s baseline.
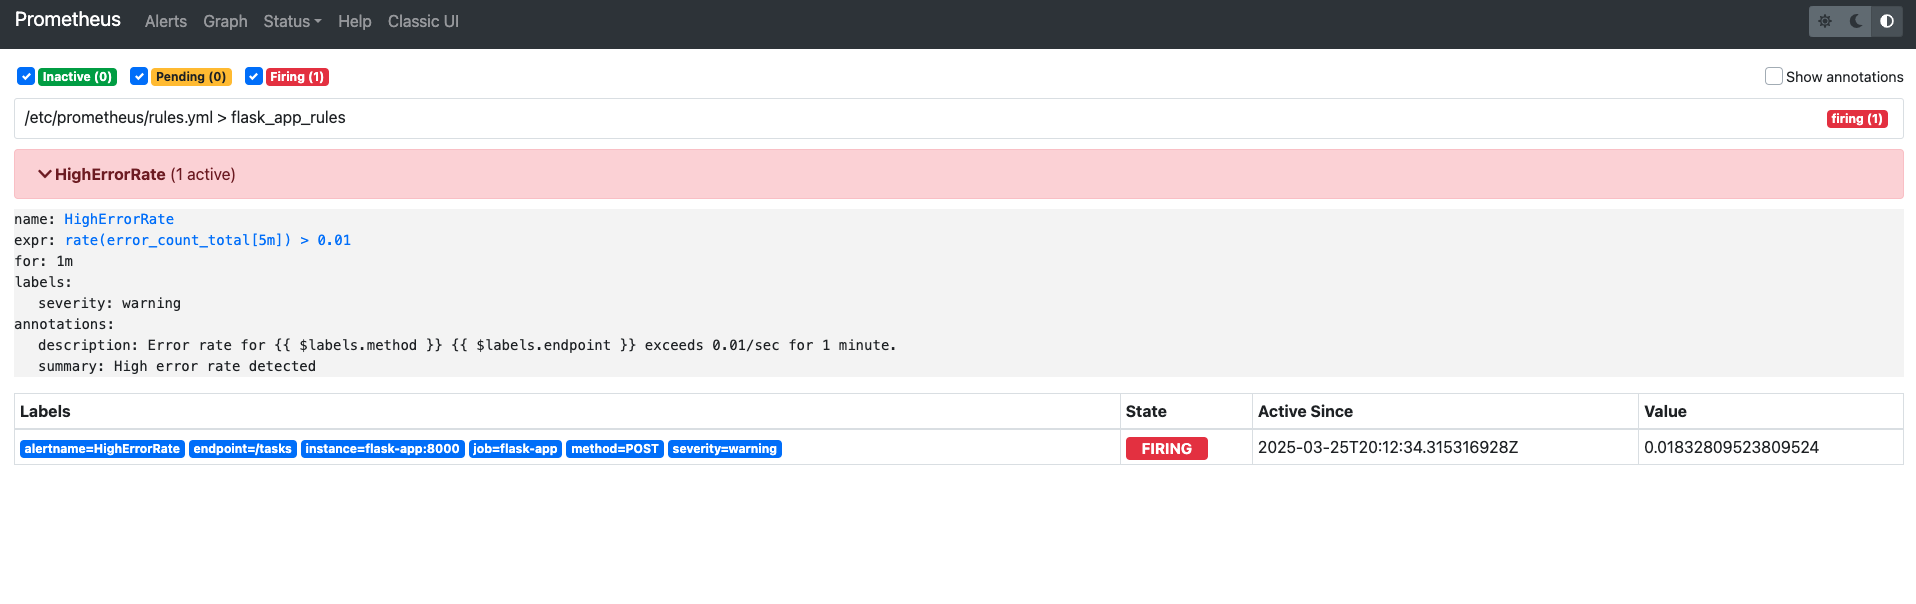 HighErrorRate Alerts shown in Prometheus
Step 3: Deploy to AWS EC2
I took the app from my laptop to AWS EC2, starting with the Flask container alone, then scaling to the full stack including app, Prometheus, Grafana, and Alertmanager via Docker Compose. This required pushing files to EC2 and opening ports, mimicking a real deployment.
- Takeaway: Cloud deployment tests portability and prepares you for production challenges.
- Action: Push your container to a cloud provider and run it with all services.
Restrict EC2 security group rules to your IP for ports like 5000, 9090, 3000, and 9093 and avoid leaving them open to
0.0.0.0/0.
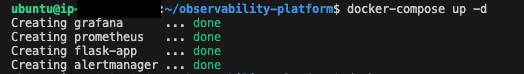 EC2 terminal running ‘docker-compose up -d’
Step 4: Troubleshoot and Validate
Things didn’t work right away. Alertmanager crashed due to a config error, and EC2 ports clashed. Fixing the alert rule (using error_count_total) and clearing old containers got it running. Testing confirmed alerts fired on both local and cloud setups.
- Takeaway: Troubleshooting is part of reliability. Expect hiccups and learn from them.
- Action: Test thoroughly, tweak configs, and verify all endpoints.
Check container logs with
docker logs <container-id>to diagnose crashes like Alertmanager config errors.
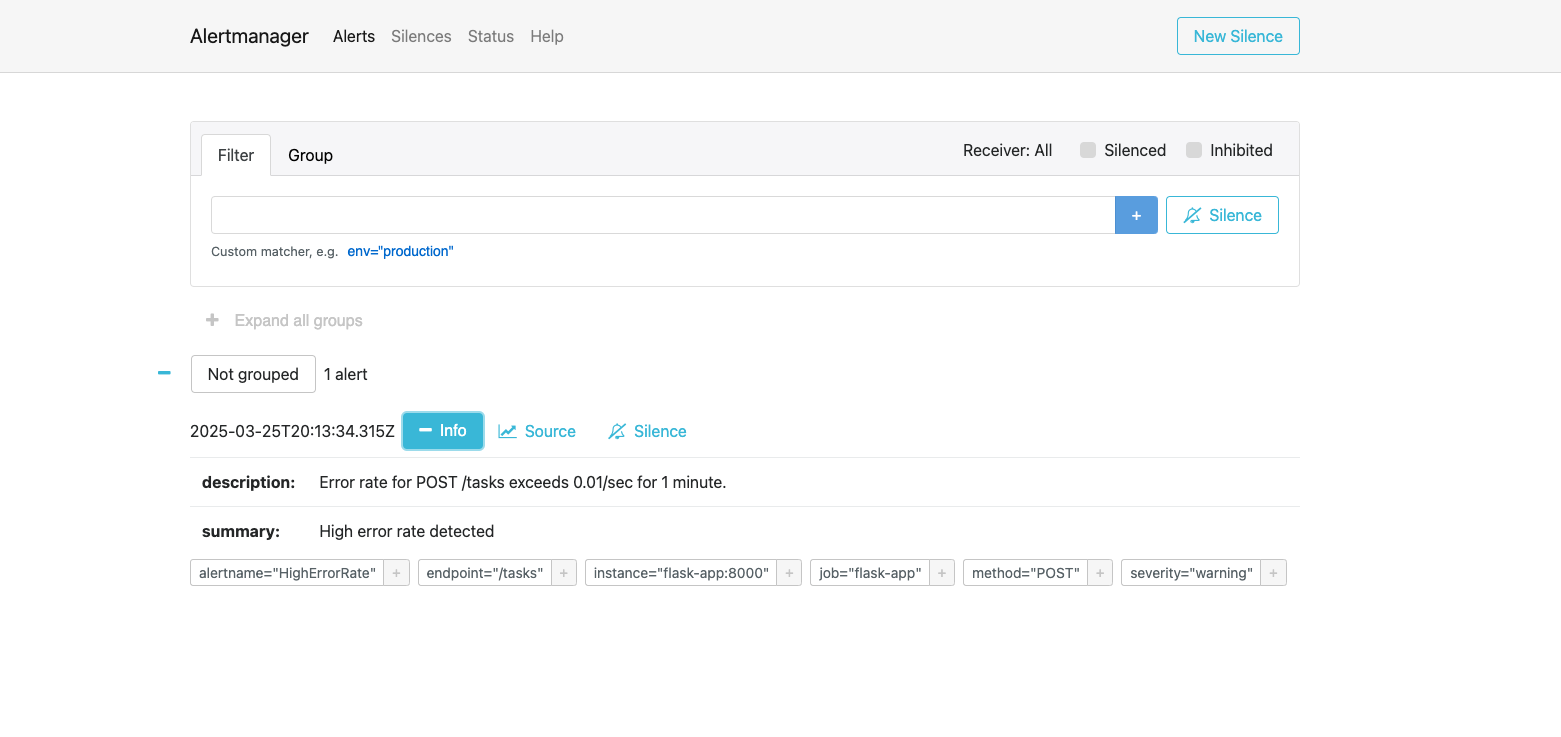 Alertmanager UI showing a ‘HighErrorRate’ alert
Why This Matters for SRE
This phase ties together RED, rate, errors, duration, into a system that not only tracks but reacts. Alerting shifts us to proactive SRE, while cloud deployment proves our stack’s ready for real world use. It’s a step toward USE (Utilization, Saturation, Errors) too, with error monitoring in place. Reliability isn’t just theory now, it’s running live.
Try It Yourself
Want to replicate this? Here’s the rundown:
- Add an error metric to your app to tie it to failures.
- Configure Prometheus rules and Alertmanager. Start simple with a log receiver.
- Deploy to a cloud provider like EC2 and use Docker Compose for the full stack.
- Test and fix: hit your app, check alerts, adjust as needed.
Best Practices Recap
- Start Small: Track one error type first and expand later.
- Test Alerts: Trigger them manually to ensure they work.
- Cloud Prep: Clear old containers before redeploying.
Up Next
In part 4 we will deepen observability with persistence (SQLite), logs (Loki), and richer dashboards. We’re building a system that’s not just reliable but insightful. Join me for the next step!