SRE Foundations to Production: Grafana Metrics (Part 2)
Build on your Flask app’s monitoring by adding Grafana dashboards to visualize Prometheus metrics and enhance reliability.
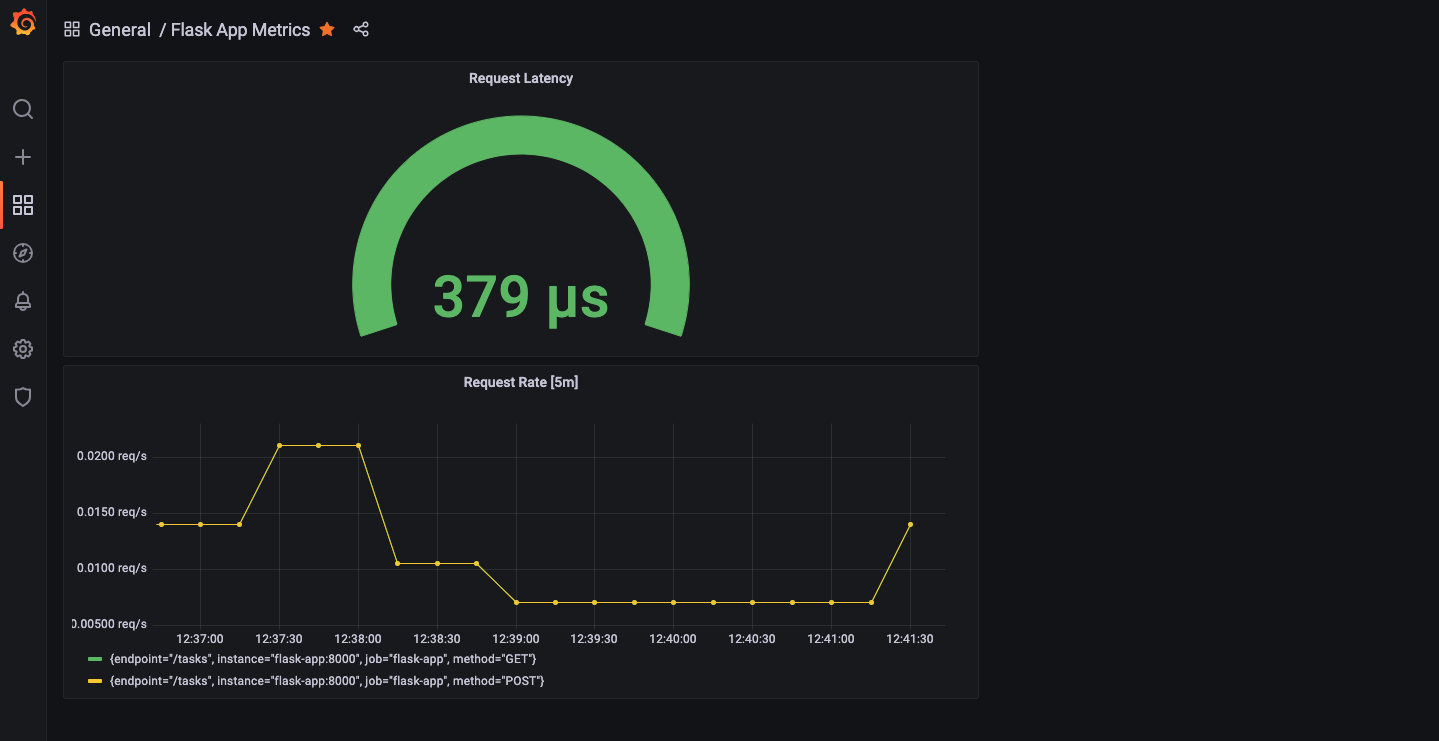 Grafana dashboard showing app metrics
Welcome back to part 2 in our SRE Basics series. Last time, we built a Flask app from scratch, added some Prometheus metrics, laying a solid foundation. Now, I’ll enhance observability by adding Grafana to the setup. This turns raw numbers into dashboards that make the app’s behavior clear. It’s not just about graphs—it’s about understanding your system, a key SRE skill. Here’s the three-step process I followed, why it matters.
Step 1: Hook Up Grafana to the Stack
First, I needed Grafana running alongside my Flask app and Prometheus. I fired up Docker Compose and added a Grafana service. A quick tweak to the docker-compose.yml, a docker-compose up, and Grafana was live on port 3000. It’s like adding a new screen to your control room, ready to show off the data we’ve been collecting.
Takeaway:Stacking services like this is how SREs build observability, each tool has a job, and they play nice together.Action:Toss Grafana into your Docker setup. Pull the image, map port 3000, and give it a spin, your app doesn’t even need to know it’s there.
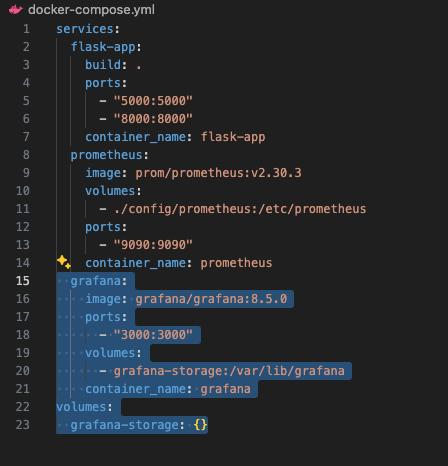 docker-compose file with grafana code highlighted
Step 2: Connect the Dots with Prometheus
With Grafana running, I pointed it at Prometheus, our metrics goldmine from part 1. Logged into Grafana (default admin/admin, changed it to something secure), added a Prometheus data source with http://prometheus:9090, and hit “Save & Test.” Green light! Now Grafana could see all those request counts and latencies we’d been tracking. It’s like plugging in a monitor to your app’s vital signs.
Takeaway:Data sources are the glue in observability, without them, your dashboards are just blank canvases.Action:Link Grafana to your metrics store (Prometheus in my case). Use the service name from Docker Compose, it’s networking magic.
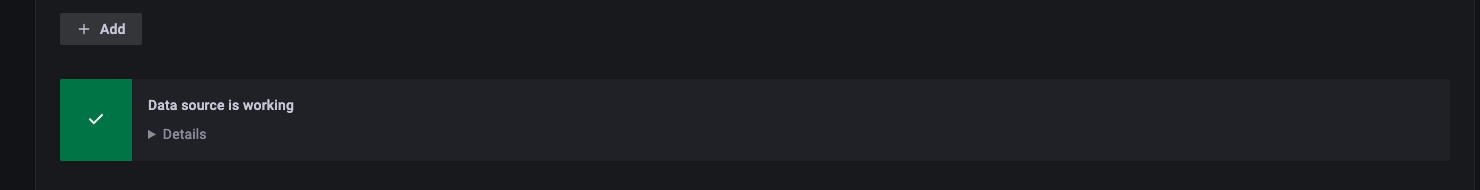 Grafana image confirming data source is working
Step 3: Build Dashboards for Insights
This step brought the data to life. I built a dashboard to see what my app’s up to. Dropped in a “Request Rate” panel with rate(request_count[5m]) and then I could see requests per second over time. Then added a “Request Latency” panel with request_processing_seconds_count, I could watch how fast (or slow) my app responds. Hit the API a few times with curl, refreshed the dashboard, and there it was: lines moving, numbers making sense.
Takeaway:Dashboards turn metrics into stories with spikes, trends, and patterns you can act on. That’s RED method vibes (Rate, Errors, Duration) coming alive!Action:Create a couple panels, rate and latency are great starters. Query your metrics, pick a graph, and watch your app talk back.
Align your panels with the RED method, start with Rate and Duration, then add Errors in the next part for full visibility.
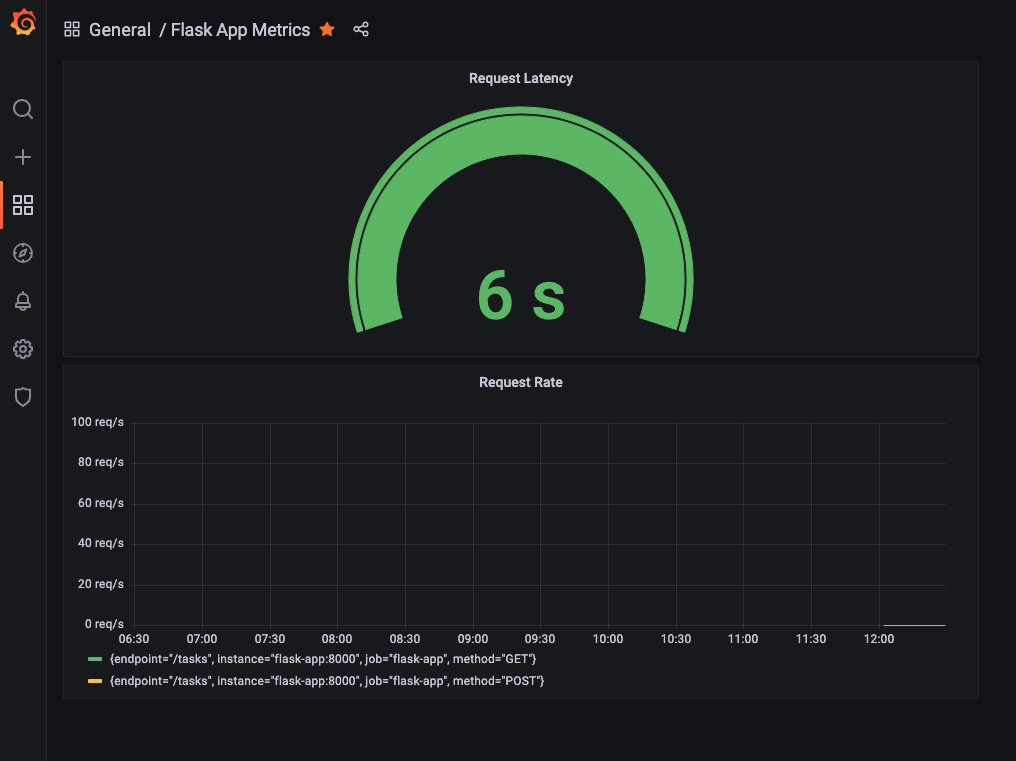 Close up image of Grafana panels for Request Latency and Request Rate
Why This Matters for SRE
Part 2 isn’t just about pretty pictures, it’s about visibility, a cornerstone of reliability. With Grafana, I’m not guessing how my app’s doing, I’m seeing it. Request rates show me traffic (Rate from RED), latency tracks performance (Duration), and I’m prepped to add errors next. This is how SREs stay ahead of trouble, by knowing what’s normal before it’s not. Plus, it’s a step toward USE (Utilization, Saturation, Errors), we’ll get there with more metrics soon. You’re not just coding now; you’re observing like a pro.
Try It Yourself
Ready to see your app in a new light? Try the following:
- Add Grafana to your Docker Compose file, port 3000, a volume for persistence, done.
- Connect it to your Prometheus instance, point it at the right URL and test it.
- Build a dashboard, grab a couple metrics (like request rate), tweak the visuals, and hit your app to see it live.
Best Practices Recap
Keep It Simple:Start with a few panels, rate and latency are plenty to get hooked.Persist It:Use Docker volumes so your dashboards don’t vanish on restart.Name Smart:Service names in configs (like prometheus) keep things tidy and portable.
Don’t lose your dashboards, always use Docker volumes to persist Grafana data across restarts.
Up Next
In Part 3, I’ll add alerting with Alertmanager and deploy the setup to the cloud. This will include notifications for when things go wrong and running the app somewhere other than my laptop. We’ll also add error metrics to complete the RED method. Join me as we continue building reliability.