SRE Foundations to Production: Monitorable Flask App Setup (Part 1)
Turn a Flask app into a monitorable system with tests, logs, Docker, and Prometheus for SRE reliability.
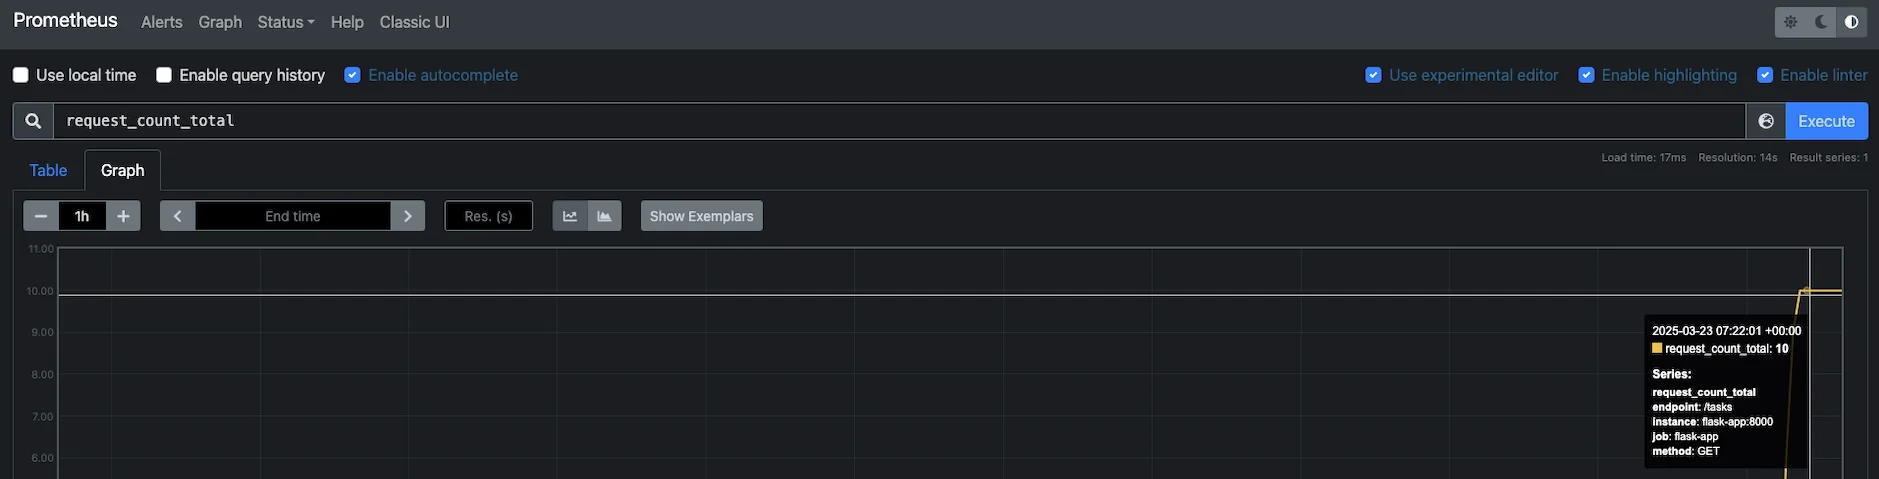 Hero image showing prometheus graph view
Thanks for joining me for the start of this SRE foundations series. I’ve always been curious about how to take a simple web app and make it something an SRE can monitor effectively. In this 7-part series, I’ll begin by building a basic observability platform and evolve it into a fully featured, scalable, and secure system with advanced observability, Kubernetes, and more. For Part 1, I’ll set up a basic Flask app with the SRE essentials to make it observable. You don’t need to be a Python wizard—this is about the process, not the syntax.
Here’s the five-step process I followed to get this app ready for observability, with SRE skills you can apply to your own projects.
Step 1: Spin Up a Simple Web App
First things first, I needed something to monitor. I created a Flask app, a lightweight to-do list API with two endpoints: GET /tasks to list tasks and POST /tasks to add one. It’s basic, but that’s the point. We start small so we can focus on observability.
Takeaway:Keep your app lean at the start. Complexity comes later; reliability starts now.Action:Pick a framework (I chose Flask), write a couple of endpoints, and run it locally. Make sure it responds to requests. Mine returned an empty list ([]) out of the gate.
1
2
$ curl http://localhost:5000/tasks
[]
Step 2: Add Unit Tests (Yes, SREs Care About This!)
Before focusing on monitoring, I added unit tests. SRE isn’t just about watching systems fail—it’s about preventing issues with a solid foundation. I used Python’s unittest to verify my endpoints worked as expected: GET returns 200, and POST either succeeds or fails gracefully.
Takeaway:Tests catch bugs before they hit production, reducing error rates (hint: RED method incoming later). They’re your first line of defense.Action:Write basic tests for your app’s core functionality. Don’t overcomplicate it—just ensure it doesn’t fail unexpectedly. I ran into some import issues (likeNameErrorandAttributeError), but fixing them helped me keep my module structure clean.
1
2
3
4
5
6
7
8
9
10
11
12
13
14
15
16
17
18
19
20
21
22
23
24
25
26
27
28
29
30
import unittest
from app.app import app

class TestFlaskApp(unittest.TestCase):
    def setUp(self):
        app.config['TESTING'] = True
        self.client = app.test_client()
        # Reset tasks list before each test
        tasks.clear()

    def test_get_tasks_empty(self):
        response = self.client.get('/tasks')
        self.assertEqual(response.status_code, 200)
        self.assertEqual(response.json, [])

    def test_add_task_success(self):
        response = self.client.post('/tasks', json={"task": "Buy milk"})
        self.assertEqual(response.status_code, 201)
        self.assertEqual(response.json, {"message": "Task added"})
        # Verify task was added
        response = self.client.get('/tasks')
        self.assertEqual(response.json, ["Buy milk"])

    def test_add_task_no_data(self):
        response = self.client.post('/tasks', json={})
        self.assertEqual(response.status_code, 400)
        self.assertEqual(response.json, {"error": "No task provided"})

if __name__ == '__main__':
    unittest.main()
These basic tests will evolve into a more comprehensive test suite in future posts.
Step 3: Log Like You Mean It
Next, I added structured logging with python-json-logger. Instead of plain text logs like “Hey, someone hit the endpoint,” I used JSON logs, such as {“levelname”: “INFO”, “message”: “GET /tasks called”}. JSON logs are easier for tools like Loki (which we’ll explore later) to parse, making debugging more effective.
Takeaway:Structured logs are a powerful observability tool—readable by both humans and machines.Action:Add a logging library, uselogger.info()andlogger.warning()calls in your code, and test they fire. I updated my tests to capture logs, ensuring I didn’t miss anything.
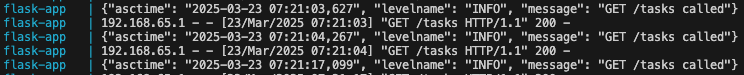 Image showing JSON logs from a Flask App
We’ll expand on this logging foundation with advanced log aggregation later.
Step 4: Containerize It
Time to get modern. I wrapped the app in a Docker container. This locks in dependencies (Flask, logging libs) and ensures it runs the same everywhere. I wrote a Dockerfile, added a .dockerignore to keep junk out, and tested it with a shell script to confirm the API still worked.
Takeaway:Containers ensure consistency—no more “works on my machine” excuses, which is invaluable for reliability.Action:Create aDockerfile, build your image (docker build -t my-app .), and run it (docker run -p 5000:5000 my-app). Hit it with a request to see it in action. Bonus: script a test to automate the check.
Don’t forget to use a
.dockerignorefile—excluding unnecessary files prevents bloated images and ensures consistent builds across environments.
1
2
$ docker build -t my-app .
$ docker run -p 5000:5000 my-app
This containerization sets us up for multi-instance deployment, load balancing, and eventually Kubernetes orchestration.
Step 5: Measure It with Prometheus
Finally, I added Prometheus metrics to track requests and latency. Using prometheus-client, I included a counter for request totals and a summary for latency. I then set up Prometheus in Docker Compose to scrape these metrics from my app on port 8000. This gave me numbers to monitor, like request counts and latency in seconds, ready for dashboards and alerts.
Takeaway:Metrics are the pulse of your system—start with basics like rate and duration (RED method concepts) to enable proactive monitoring.Action:Add a metrics library, expose an endpoint (I used 8000), and set up Prometheus with Docker Compose. Check http://localhost:9090 to see your metrics live—it’s a good way to confirm everything’s working.
The RED method (Rate, Errors, Duration) helps SREs monitor system healt. Focus on these metrics to catch issues early.
These basic metrics give us visibility now. We’ll expand upon these later with enhanced dashboards.
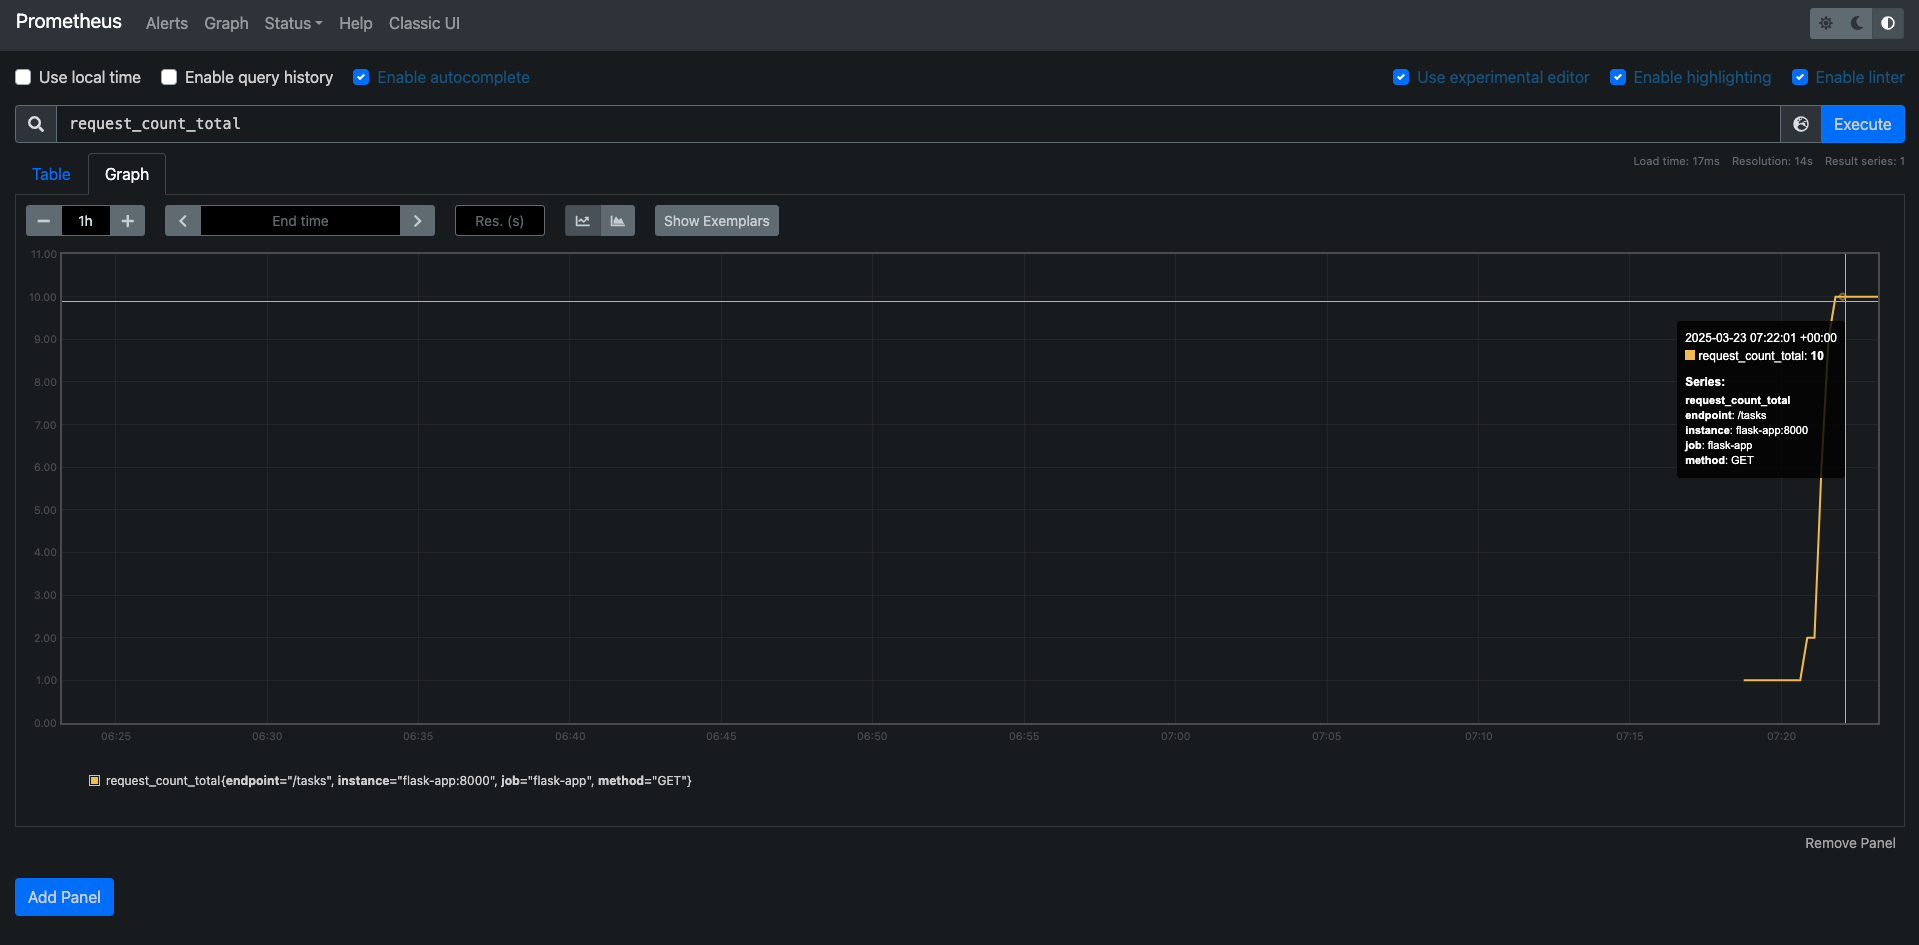 Prometheus dashboard image showing the request_count_total and graph
Why This Matters for SRE
This isn’t just a Flask app anymore, it’s a monitorable system. We’ve laid the groundwork with:
Testing:Catching issues early.Logging:Capturing events for debugging.Containerization:Ensuring consistency.Metrics:Quantifying performance. These are core SRE practices that embed reliability into your app from the start. In the coming parts, I’ll add Grafana for visualization and Loki for log aggregation, but this is a solid base to build on.
We’re just beginning to explore SRE practices. As the series progresses, we’ll cover other key areas like Kubernetes, chaos engineering, and security. This foundation of testability, observability, and containerization makes those future steps possible.
Prerequisites for Following Along
If you’re planning to follow this series through until the end, you’ll need:
- Basic knowledge of Python and Docker
- An AWS/GCP/Azure account (or equivalent) for cloud deployment
- Willingness to learn Kubernetes basics
Don’t worry if you’re missing some of these, I’ll explain each step as we go.
Try It Yourself
Want to follow along? Here’s the quick rundown:
- Build a simple web app (any language works).
- Add unit tests to keep it reliable.
- Use structured logging—JSON is a good choice
- Dockerize it for portability.
- Add Prometheus metrics and watch it run.
Ensure
docker-composeis installed before running the commands, it’s required to spin up the services.
Best Practices Recap
Start Small:A tiny app lets you focus on observability, not feature creep.Test Early:Catch errors before they’re incidents.Log Smart:Structured logs pay off down the line.Containerize:Consistency is king.Measure Everything:Metrics are your eyes into the system.
Up Next
In Part 2, I’ll take observability further by adding Grafana to visualize the Prometheus metrics we set up. You’ll see dashboards showing request rates, latencies, and more, turning raw data into actionable insights. Stay tuned as we continue to build reliability in the next post.