SRE Foundations to Production: Advanced Monitoring Setup (Part 6)
Run two Flask instances with PostgreSQL, monitor USE/RED metrics via Prometheus and Grafana, and load test with Locust to push reliability.
Thanks for joining me for Part 6 of this SRE series. In the previous posts, we built a Flask app with monitoring capabilities. During this process, we hit 92% CPU, which triggered a HighCPUUsage alert, but 50 to 60% failures under load showed there’s still work to do. Shifting from EC2 to Docker Compose, I’ll take observability further by running two instances with PostgreSQL, track USE/RED metrics, and test reliability with Locust. Here’s the five-step process I followed, with insights for building your own SRE skills.
Step 1: Migrate to PostgreSQL
We swapped SQLite for PostgreSQL to support multiple instances, updating app.py with psycopg2 and adding a db service in docker-compose.yml.
- Takeaway: Reliable data layers are foundational for multi-node systems.
- Action: Switch to a scalable DB and test concurrency.
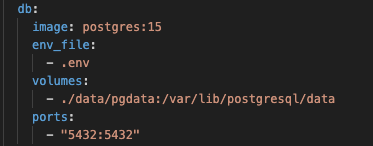 PostgreSQL added to docker-compose
Step 2: Stabilize with Retry Logic
PostgreSQL startup delays crashed the app (psycopg2.OperationalError). We added retry logic in init_db, fixed a NameError for update_resources, and dropped before_first_request.
- Takeaway: Resilience against failures reduces downtime.
- Action: Implement retries for external dependencies.
Cap retries (e.g., 5 attempts, 2s delay) to avoid infinite loops on persistent failures.
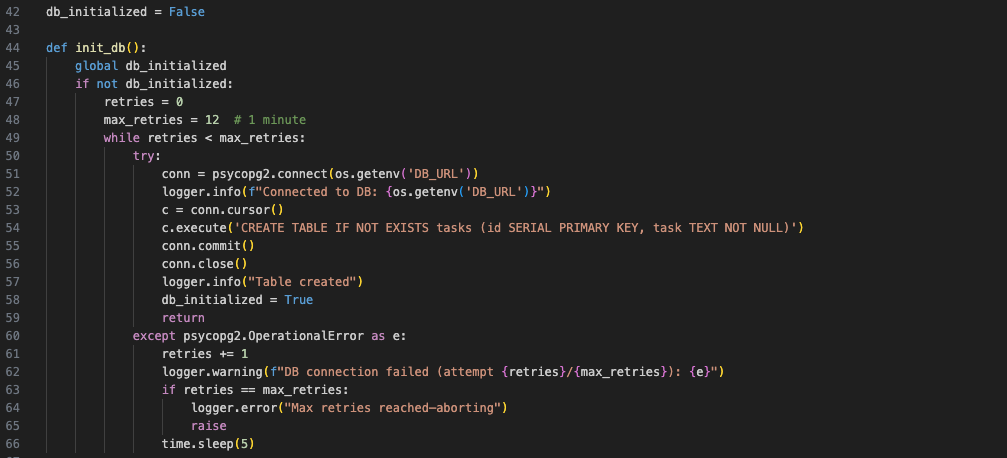 Database retry logic in app.py
Step 3: Monitor Multiple Instances with Nginx
Two Flask instances (flask-app-1, flask-app-2) ran on port 5000 internally, proxied by Nginx for load balancing. Prometheus scraped cpu_usage_percent and request_count_total, and Grafana visualized USE metrics, including utilization and errors.
- Takeaway: Aggregated metrics reveal system health across nodes.
- Action: Scale instances, add a load balancer like Nginx, and monitor with Prometheus and Grafana.
Label instances in Prometheus (e.g.,
instance="flask-app-1") for clear Grafana visuals.
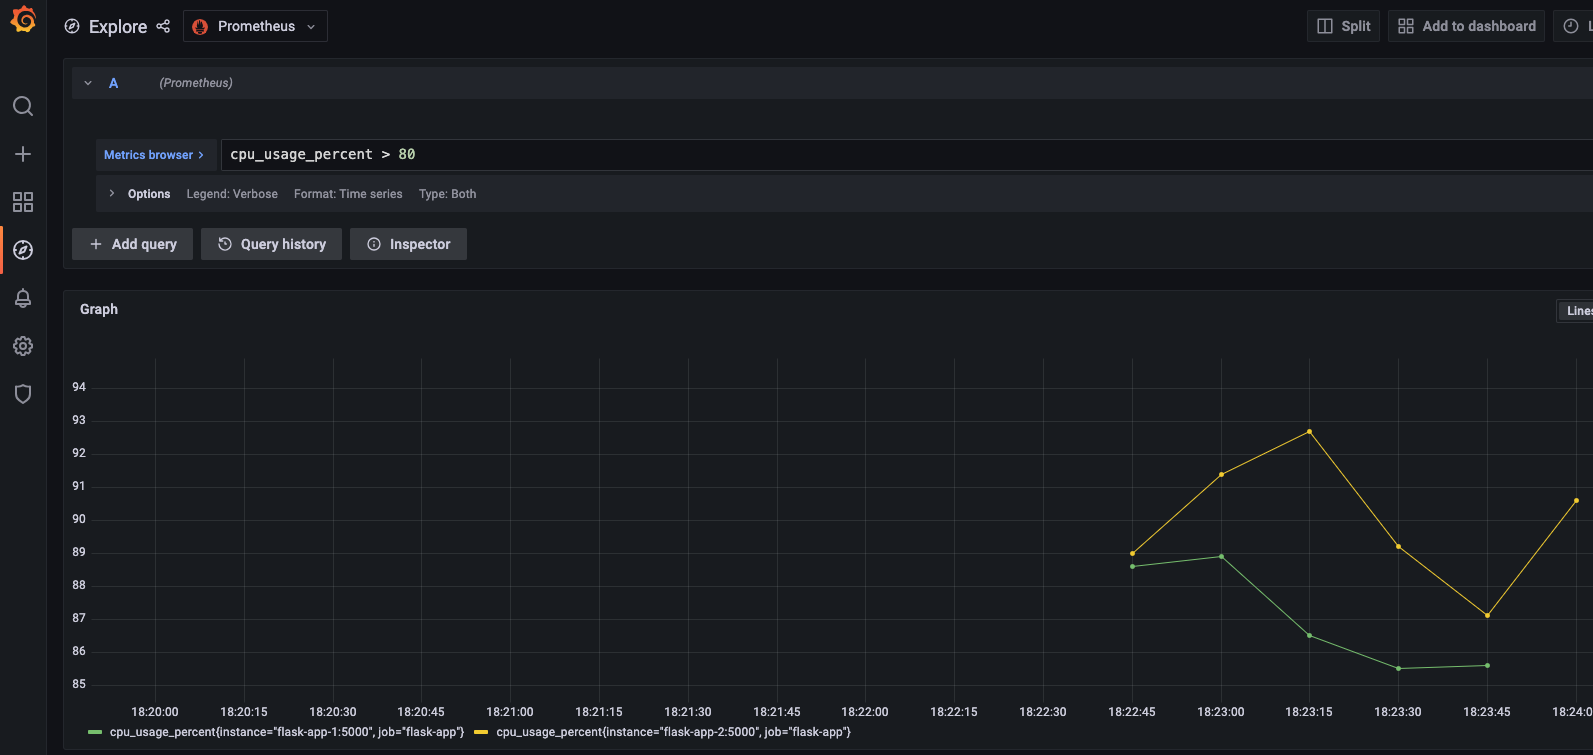 CPU Usage panels as shown in Grafana
Step 4: Fix Prometheus Targets
Metrics didn’t reach Grafana because prometheus.yml targeted port 8000 while Flask ran on 5000. Logs pinpointed the issue, resolved by updating to flask-app-1:5000 and flask-app-2:5000.
- Takeaway: Misaligned configs break observability, so trust your logs.
- Action: Verify ports match between app and monitoring.
Dual ports (5000:5000, 8000:8000) in Docker Compose can mislead, so check
docker logsto confirm.
1
2
3
$ docker logs flask-app-1
[2025-03-29 02:48:27 +0000] [1] [INFO] Starting gunicorn 23.0.0
[2025-03-29 02:48:27 +0000] [1] [INFO] Listening at: http://0.0.0.0:5000
Step 5: Load Test and Alert
Locust simulated 1000 users at a 100 spawn rate, pushing CPU to 92%. A HighCPUUsage alert triggered at over 80% for 5 minutes, but 50 to 60% failures (RemoteDisconnected, 500s) revealed strain.
- Takeaway: Load tests expose limits, alerts flag issues, and failures provide lessons.
- Action: Stress your system and refine alerts.
High failures (50 to 60%) under load signal scaling limits, so consider tuning Gunicorn workers or adding a load balancer next.
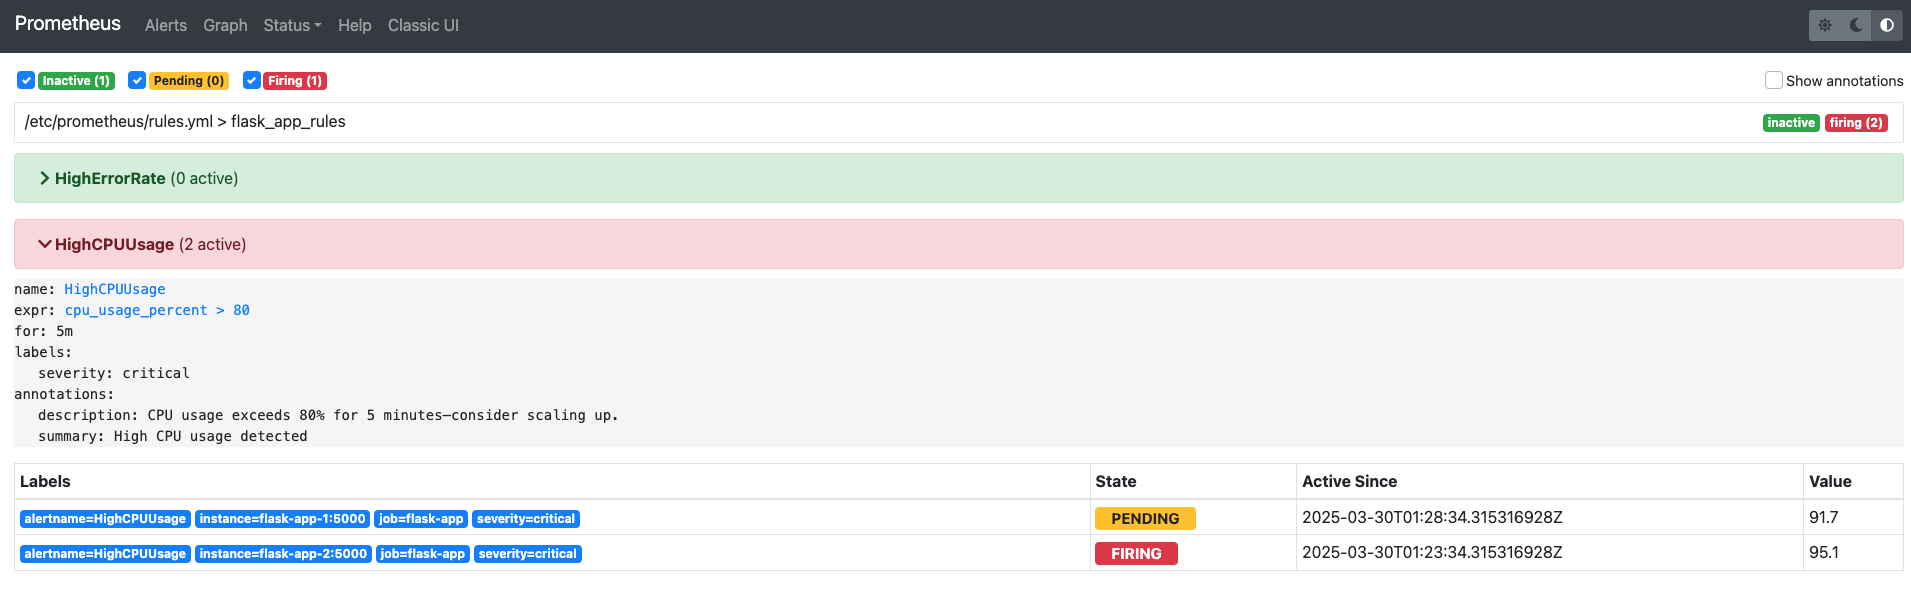 HighCPUUsage Alerts firing in Prometheus
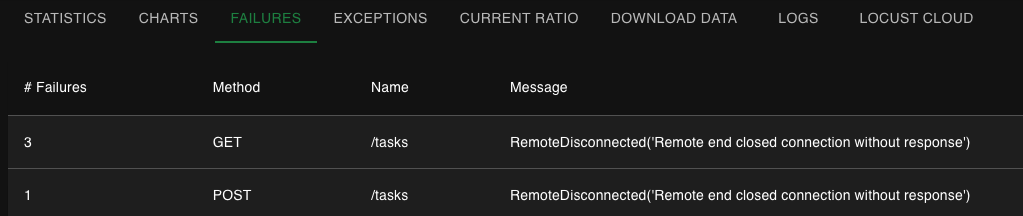 Locust showing RemoteDisconnected errors
Step 6 (Optional): Chaos Testing
- Ran basic chaos tests (e.g., killing a Flask instance) to verify resilience.
- Takeaway: Chaos exposes weak points—start small.
- Action: Kill a container and check recovery.
Why This Matters for SRE
In part 6 we created an SRE playground with live USE metrics (CPU and memory utilization, errors) and RED metrics (request rates, errors), plus a basic alert. Two instances with Nginx mimic a distributed setup, ideal for chaos testing and recovery drills. The high failure rate sets up our next challenge.
Try It Yourself
Build your SRE skills:
- Use PostgreSQL by adding
psycopg2-binaryand adbservice. - Stabilize by retrying DB connections.
- Scale by running two instances.
- Monitor by fixing Prometheus ports.
- Test by loading with Locust and setting an alert.
Best Practices Recap
- Resilience: Retries beat crashes.
- Observability: Align ports for metrics flow.
- Testing: Push limits to learn.
Up Next
In Part 7, I’ll focus on securing Postgres with Secrets and ensuring full USE and RED metric coverage on Kubernetes using Minikube. This will keep us aligned with SRE principles as we wrap up the series.