SRE Foundations to Production: SQLite, Loki, and Dashboards (Part 4)
Enhance your Flask app’s observability with SQLite persistence, Loki log aggregation, and advanced Grafana dashboards in this SRE-focused guide.
Let’s continue our SRE journey. In part 3, we added alerting with Alertmanager and deployed our Flask app to AWS EC2. Now, in part 4, we’re enhancing observability with persistent storage, log aggregation, and richer dashboards. These steps make our app more realistic and insightful, which are key traits of a reliable system. Here’s how I tackled it in four steps, with lessons for your own projects.
Step 1: Add Persistence with SQLite
I swapped the in-memory task list for SQLite, adding full CRUD functionality of create, read, update, delete. Tasks now persist across restarts, stored in a tasks.db file outside the container, mimicking production setups where data lives beyond ephemeral instances.
Always mount database files outside the container, as internal storage risks data loss on container restarts.
- Takeaway: Persistence ensures state survives failures, which is a must for real-world reliability.
- Action: Replace volatile storage with a database; mount it externally for durability.
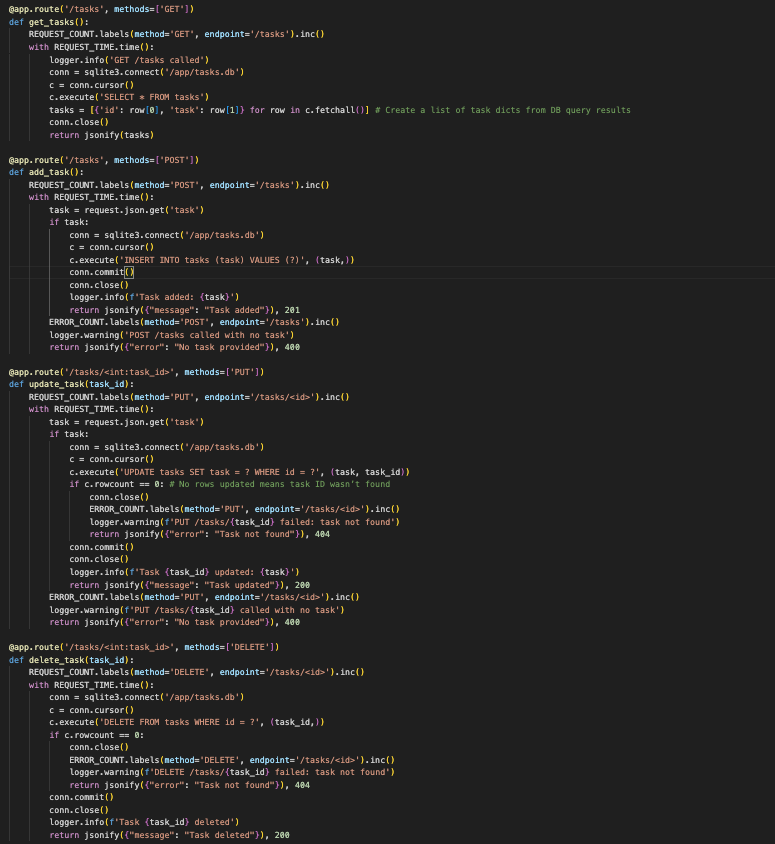 CRUD endpoints in app.py using SQLite
Step 2: Integrate Loki for Log Aggregation
Next, I added Loki and Promtail to collect and store logs. The app now writes structured JSON logs to a file, which Promtail scrapes and sends to Loki. This gives us a centralized log history, searchable and ready for analysis.
Ensure Promtail’s config points to your log file’s exact path to avoid scraping issues.
- Takeaway: Logs provide context to metrics, which is vital for debugging and understanding incidents.
- Action: Set up a log aggregator and point your app’s output to it.
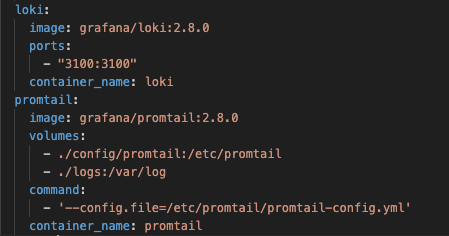 docker-compose file updated with loki and promtail services
Step 3: Enhance Grafana Dashboards
With Loki in place, I connected it to Grafana and added a logs panel showing app activity. I also introduced an error rate panel (rate(error_count_total[5m])), completing our RED method visualization of rate, errors, and duration, all in one view.
- Takeaway: Unified metrics and logs in dashboards reveal system behavior at a glance.
- Action: Link your log store to Grafana and graph key metrics like error rates.
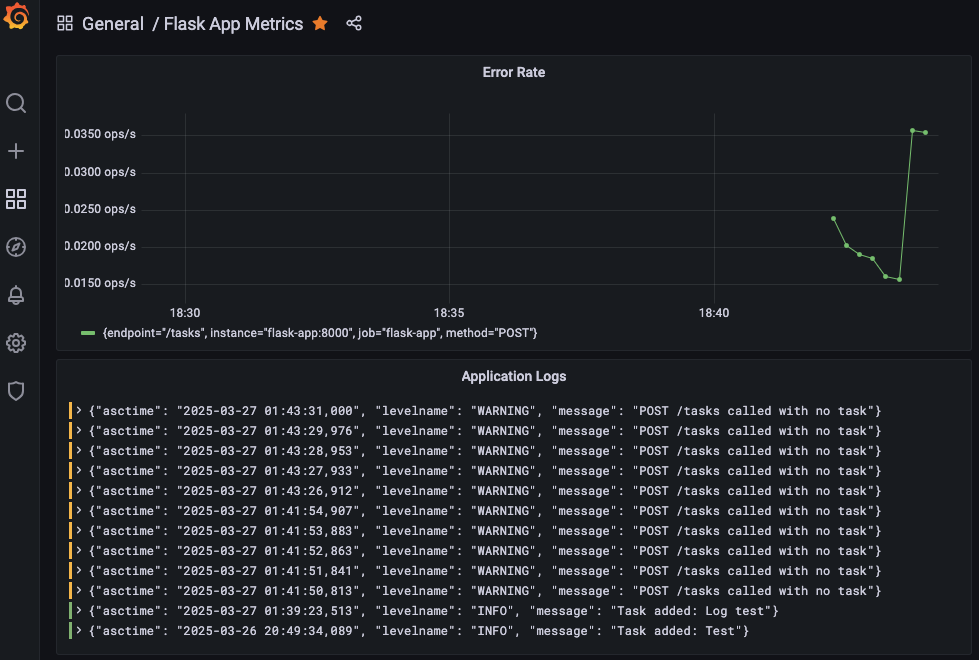 Grafana dashboard with logs and error rate panels
Step 4: Troubleshoot Persistence Hiccups
SQLite setup hit a snag when tasks.db kept appearing as a directory, crashing the app. Pre-creating it as a file and using absolute paths (/app/tasks.db) fixed it. This taught me to double-check volume mounts and file assumptions.
Use
docker volume lsto inspect mounts if files aren’t appearing as expected.
- Takeaway: Reliability includes solving unexpected quirks, as persistence demands precision.
- Action: Test storage setups thoroughly; expect the unexpected.
1
$ curl -X POST -H "Content-Type: application/json" -d '{"task": "Test"}' http://localhost:5000/tasks
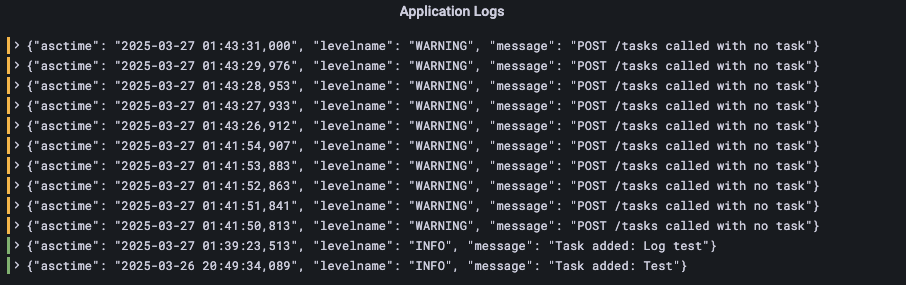 Grafana logs panel showing the ‘Test’ task added via curl
Why This Matters for SRE
Part 4 builds a system that’s not just monitored but understood. SQLite adds resilience, Loki enriches context, and dashboards tie it together, advancing RED and laying groundwork for USE (Utilization, Saturation, Errors). We’re moving beyond basics to a mature observability stack.
Try It Yourself
Ready to try this? Here’s how:
- Add SQLite to your app, implement CRUD and mount the DB file externally.
- Set up Loki and Promtail, pipe logs through a file to a central store.
- Enhance Grafana, add logs and error rate panels.
- Test it by hitting your endpoints and watching the dashboard.
Best Practices Recap
- External Storage: Keep data outside containers for persistence.
- Log Structure: Use JSON for searchable, consistent logs.
- Dashboard Focus: Combine metrics and logs for clarity.
Up Next
In Part 5, I’ll explore scaling with load testing, resource monitoring, and possibly a multi-node setup. We’re pushing reliability further, so stay tuned!