SRE Foundations to Production: Scaling and Load Testing (Part 5)
Scale your Flask app with Locust load testing, monitor CPU and memory with Prometheus, and run multiple instances for production-ready reliability.
In Part 4, we deepened observability with SQLite persistence, Loki logs, and enhanced dashboards. Now, in Part 5, we test scalability and resource usage by load testing the app, tracking CPU and memory, and running multiple instances. This advances our USE method of Utilization, Saturation, and Errors while preparing the system for real-world demands. Here’s how I approached it in four steps, with insights for your own setups.
Step 1: Monitor Resource Usage
I added CPU and memory metrics using psutil and Prometheus’ Gauge. A background thread updates these every few seconds, exposing them alongside existing metrics like request counts and errors. This provides visibility into resource utilization, a key piece of the USE puzzle. For saturation, I went with request processing time as a stand-in metric. It’s a decent way to spot when the system’s getting bogged down. In a full-on SRE setup, we’d dig into stuff like queue lengths or thread pool stats, but for this intro series, it does the trick. We’ll save the deep dive into comprehensive USE metrics for a future project. Plenty more to explore there.
- Takeaway: Resource monitoring catches saturation before it impacts users.
- Action: Instrument your app with CPU and memory metrics via a metrics library.
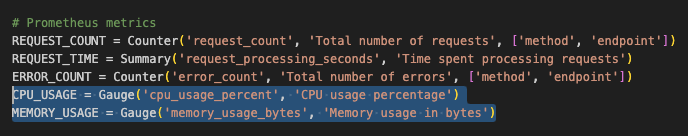 CPU_USAGE and MEMORY_USAGE added to app.py
Step 2: Set Up Load Testing with Locust
To stress the app, I introduced Locust, a Python-based load testing tool. A simple script simulates users hitting GET and POST endpoints, allowing us to measure performance under pressure. This helps identify bottlenecks and validate scaling.
- Takeaway: Load testing ensures your system handles traffic spikes gracefully.
- Action: Write a load test script and run it against your app’s endpoints.
Start with a low user count (e.g., 10) in Locust to establish a baseline before scaling up.
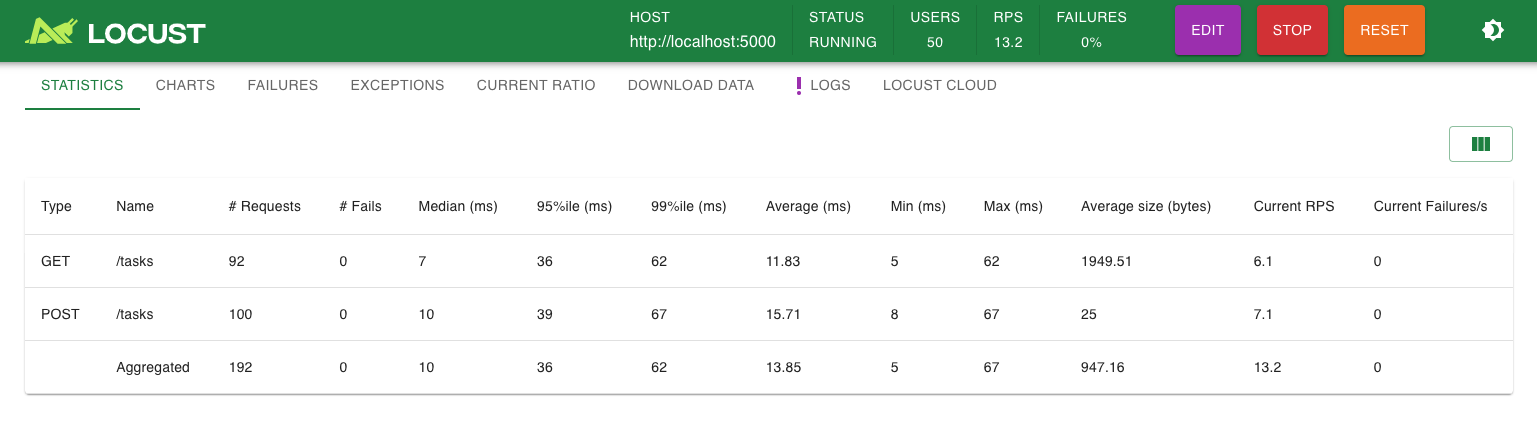 Locust UI showing 50 users and request stats
Step 3: Scale with Multiple Containers
I updated Docker Compose to run two Flask instances (flask-app-1, flask-app-2), sharing the SQLite database. Prometheus scrapes both, and Grafana visualizes the combined metrics. This simulates a basic multi-node setup, testing data consistency and observability across instances.
- Takeaway: Scaling horizontally requires coordinated monitoring and storage.
- Action: Spin up multiple app instances and ensure metrics aggregate correctly.
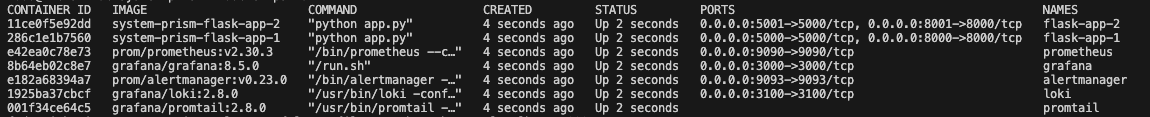 ‘docker ps -a’ output showing two flask containers
Step 4: Troubleshoot Metrics and Caching
Adding resource metrics hit two snags. First, I forgot to import Gauge in app.py, which crashed the app but was fixed with a quick edit. Second, Docker cached the old image, hiding the fix. Forcing a rebuild with --no-cache resolved it, serving as a reminder to watch build behavior.
- Takeaway: Small oversights and caching can derail deployments, so verify every layer.
- Action: Check imports and force fresh builds when debugging.
Docker may cache old images, so use
docker-compose build --no-cacheto ensure changes like fixed imports are applied.
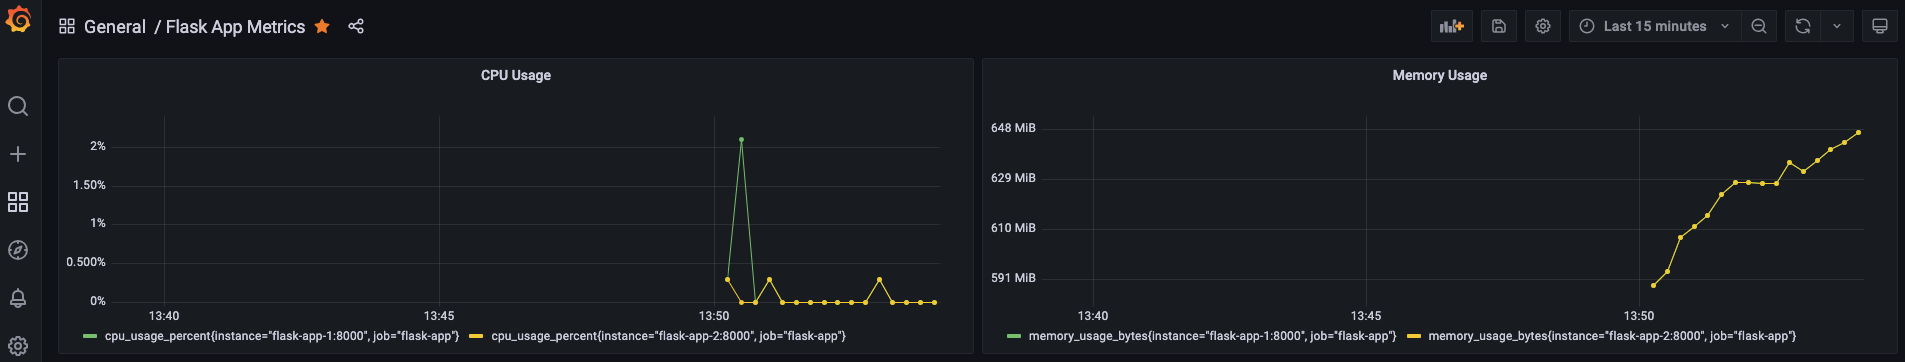 Grafana UI showing CPU and Memory Usage panels
Why This Matters for SRE
Part 5 pushes reliability into production territory. Resource metrics track utilization and saturation, load testing validates capacity, and scaling tests resilience, fully realizing USE alongside RED. We’re not just observing now but preparing for scale.
Try It Yourself
Want to scale your app? Here’s the rundown:
- Add CPU and memory metrics using
psutiland expose them via Prometheus. - Set up Locust to simulate traffic and watch the response.
- Run multiple instances by updating Docker Compose and Prometheus targets.
- Test and tweak while monitoring Grafana under load.
Best Practices Recap
- Granular Metrics: Track resources per instance for precise insights.
- Load Realism: Start small with tests, then ramp up.
- Build Fresh: Avoid caching surprises with
--no-cache.
Up Next
In part 6 we will refine this and add a load balancer, switch to Postgres, and set up load-based alerts. We’re building a robust, observable system, so join me for the next step!